
IEEE Research Paper · Co-Author
Intraday Market Analysis and Forecasting with LSTM Networks
2025 5th International Conference on Advancement in Electronics & Communication Engineering (AECE) · November 2025
This paper asks whether a model can forecast a stock’s daily high and low price using nothing but its own trading history — no news sentiment, no macroeconomic indicators, just the numbers the market has already produced.
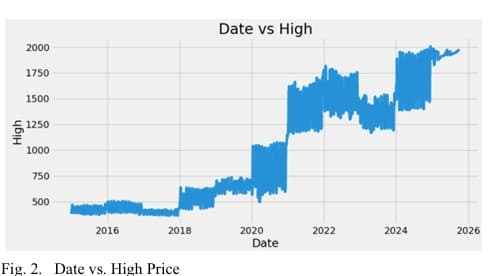
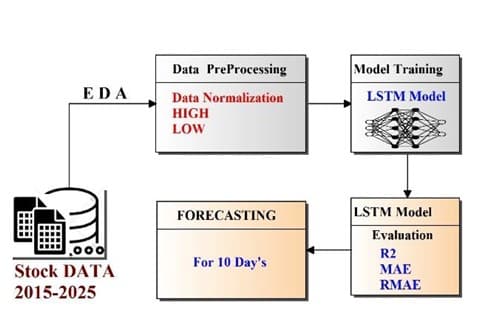
The dataset was ten years of daily price data for a publicly traded company (2015–2025), pulled from Yahoo Finance. The values were normalized with Min-Max scaling, then reshaped into 1,500-timestep sequences — long historical windows the model could draw patterns from.
The architecture uses LSTM (Long Short-Term Memory) networks, a type of recurrent neural network built to recognize patterns across sequences over time. Rather than one model predicting both the day’s high and low, two dedicated LSTM models were trained separately, each with the Adam optimizer and mean squared error loss.
HIGH-PRICE MODEL
R² = 0.954
MAE = 34.01
RMSE = 44.26
LOW-PRICE MODEL
R² = 0.947
MAE = 35.26
RMSE = 46.41
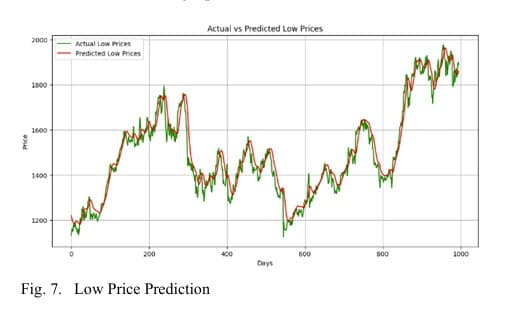
An R² above 0.94 on both models means the networks explain the large majority of the variance in next-day price movement using historical pattern alone. The paper was co-authored and published to IEEE Xplore through the AECE conference.